 If you would like to contact Leo or have a support question, please use this form, or send an email to
Introduction
Historic formulae allow you to work with basic market data or calculated results for prior dates. The basic types are as follows:
xlqh... Historic Formulae
xlqh formulae all have the same syntax, i.e. =xlqhFunctionName("Symbol","Date Reference", "Source") e.g. =xlqhClose("msft","2/2/2015","yahoo"). No additional parameters are required as all calculations are performed when the data is retrieved based on settings in xlq preferences.
All xlqh... formulae return daily results but are also available as xlqhw (weekly) and xlqhm (monthly) versions. Many of these formulae are also available as xlqXh versions.
xlqXh... Historic Formulae
xlqXh formulae allow for additional parameters to be specified, allowing you to perform any calculation 'on the fly' with no limit on the variations. The syntax is =xlqXhFunctionName("Symbol","Date Reference", "any additional parameters", "Source"). The number of additional parameters will vary depending on the formula e.g. =xlqXhSMA("msft",-1,20,"yahoo") will return a 20 day simple moving average for Microsoft from Yahoo for the last close (due to -1).
Weekly (xlqxhw...) and monthly (xlqxhm...) versions are also available.
xlqRh... Historic Range Formulae
xlqRh formulae allow for 2 date reference parameters, allowing you to perform any calculation 'on the fly' for a given start and end date. The syntax is =xlqRhFunctionName("Symbol","Start Date Reference", "End Date Reference", "any additional parameters", "Source"). The number of additional parameters will vary depending on the formula e.g. =xlqRhTotalVolume("aapl",-3,-1,"eodhd") will return sum of the volume starting from 3 trading days ago to the last day (i.e. 3 days) for Apple from EODHD.
Weekly (xlqrhw...) and monthly (xlqrhm...) versions are also available.
Dates
- Historic formulae can work with real dates, as well as relative dates, and can be entered as part of the formulae or referenced in another cell.
- When providing real dates, data will be returned for the specified date, unless it falls on a holiday or weekend, and in such a case results will be returned for the prior trading day. Real dates can be referenced directly in other cells, but when entered directly in a formula would need to be in quotes e.g. xlqhOpen("ibm","3/5/2015","yahoo"). The order of day and month would depend on your computer's settings.
- Relative dates (-X) will always return trading days, with -1 being last close, -2 the day before etc e.g. =xlqhHigh("fb",-10,"iqfeed"). Will return the high for the day 10 trading days ago. and =xlqhDate("fb",-10,"iqfeed") will return the date referenced, and the excel cell can be formatted as needed..
- When working with weekly or monthly formulae, any date for the week / month may be used to return results, and a relative -1 date would return the last partial week or month, and -2 the one before.
- xlqXh formulae and basic xlqh formulae (Open, High, Low etc.) allow for a 0 date to be specified. This is a special case allowing the last real-time price to be used as the end of series calculation, bringing any calculation up to the last price e.g. =xlqxhRSI("amzn",0,14,"tda") will return a 14 day relative strength index calculation up until and including the last real-time price from TDAmeritrade
Sources
- Yahoo - provide daily weekly and monthly historic data for many exchanges and products. Like the other sources, their close is adjusted for splits but you can choose in xlq preferences to have their dividend adjusted close returned, and have xlq adjust the open, high and low accordingly.
- IB - Interactivebrokers provide daily and weekly historic data for the many worldwide exchanges and products they cover, including for equities, indexes, options, futures, forex etc etc.
- IQFeed - provide daily, weekly and monthly historic data for the many exchanges and products they cover, including for equities, indexes, options, futures, forex etc etc.
- TDA - TDAmeritrade provide daily, weekly and monthly data for US equities and indexes.
- Tiingo - provide daily, weekly and monthly data for US and Chinese equities, funds and crypto currencies. Data can be adjusted for dividends.
Additional xlq2 sources
- EODHD - EODHistoricalData provide daily, weekly, monthly historic data adjusted as wished for over 60 exchanges, including forex, cryptos, commodities etc. along with historic dividends, splits, earnings, balance sheet, income statement, cash flow, options and more. Upcoming dividends, splits, earnings, estimates and target pricing.
For more information on EODHD click HERE - FMP - Financial Modeling Prep provide daily, weekly, monthly historic data adjusted for splits, or splits and dividends for over 50 exchanges, including forex, cryptos, commodities etc. along with historic dividends, splits, earnings, balance sheet, income statement, cash flow, growth, key metrics, ratios and more. Upcoming dividends, splits, earnings, estimates and target pricing.
For more information on FMP click HERE - Norgate - Norgate Data provide daily, weekly and monthly historic data for US, Australian and Canadian Equities and Indexes as well as Forex, Futures, Australian warrants, exchange traded options and more. Data can be adjusted as wished. Can include data back till 1950 including for delisted symbols. Historic dividends. Constituent lists, as well as historic constituent information.
- Stockwatch - provide daily historic data for US and Canadian Equities, Indexes and Options. Data is retrieved per market day and per exchange and not by symbol.
List
xlq2Lite and xlq2
xlq2
| Basic | Description | xlqh.. | xlqxh.. | Week/Month | |
| Name | Name | ||||
| Exchange | Exchange | ||||
| Open | Opening price | ||||
| Close | Closing price | ||||
| Low | Low for the period | ||||
| High | High for the period | ||||
| Volume | Volume for the period | ||||
| Change | Change since prior periods close | ||||
| ChangePercent | Change as a percent | ||||
| Date | Date for the request | ||||
| AdjustedClose | Close adjusted for splits and dividends (Yahoo only) | ||||
| UnadjustedClose | Unadjusted close including for splits (Yahoo only) | ||||
| NoOfTrades | Number of trades (IB only) | ||||
| WAP | Weighted Average Price (IB only) | ||||
| VWAP | Volume Weighted Average Price (FMP only) | ||||
| Turnover | Turnover (Norgate only) | ||||
| OpenInterest | Open Interest depending on symbol (IQFeed only) | ||||
| Last Update | Returns the date / time of last update. (no date parameter) | ||||
| NoOfPeriods | Returns the the total number of periods currently stored in xlq for the specified symbol (no date parameter) | ||||
| EarliestDate | Returns the date of the earliest period currently stored in xlq for the specified symbol (no date parameter) | ||||
| ValidDateOrNext | Returns the date if the market was open, if not returns the next date the market was open. | ||||
| DateIndex | Returns the relative (-X) date for a specific date in the past, may be used as the start / end point for a series of data. | ||||
| SymbolsToProcess | If data is being requested returns the number of symbols still being processed (no symbol or date parameter) | ||||
| Delete | Allows for a symbol to be removed from the xlq data engine programatically (no date parameter) | ||||
| Averages | Description | xlqh.. | xlqxh.. | Week/Month | |
| StdDev | returns the standard deviation (for sample) over X periods. May be calculated on different Types | ||||
| StdDevP | returns the standard deviation (for population) over X periods. May be calculated on different Types | ||||
| Mean | returns a simple moving average for X periods. May be calculated on different Types | ||||
| Median | returns the median for X periods. May be calculated on different Types | ||||
| SMA | Simple moving average of close based on parameter | ||||
| SMAx | Simple moving average of close based on preference settings | ||||
| SMAy | Another Simple moving average of close based on preference settings | ||||
| EMA | Exponential moving average of close based on parameter | ||||
| EMAx | Exponential moving average of close based on preference settings | ||||
| EMAy | Another Exponential moving average of close based on preference settings | ||||
| EMA12 | 12 period Exponential moving average (may be changed in preferences) | ||||
| EMA26 | 26 period Exponential moving average (may be changed in preferences) | ||||
| AveVolume | simple moving average of volume based on parameter | ||||
| AveVolumeEMA | Exponential moving average of volume based on parameter | ||||
| FlexAve | Type of average and Type of data used depend on parameters | ||||
| FlexAveSlope | Slope of FlexAve, can specify alternate No. of Periods than for Average | ||||
| FlexAveIntercept | Intercept of FlexAve, as per Slope | ||||
| FlexAveStdDev | Standard Deviation (sample) of Average | ||||
| FlexAveStdDevP | Standard Deviation (population) of Average | ||||
| Calculations | Description | xlqh.. | xlqxh.. | Week/Month | |
| Range | Difference between High and Low | ||||
| AveRange | (14) period Average of the Range | ||||
| AveRangeEMA | Exponential Moving Average of the Range | ||||
| TrueRange | Greater of the absolute difference between the 1)High and Low, 2) High and Prior Close, 3) Low and Prior Close. | ||||
| AveTrueRange | (14) period Average of the True Range | ||||
| AveTrueRange2 | weighted (Wilder) Average of the True Range | ||||
| AveTrueRangeEMA | Exponential Moving Average of the True Range | ||||
| ATRPercent | an X period Average (sma) True Range as a % of the last close for the range. The result is also available as a Type parameter for other formulae | ||||
| WeightedPrice | i.e. (open + high + low + close) / 4 | ||||
| TypicalPrice | i.e. (high + low + close) / 3 | ||||
| SMATP | Simple Moving Average of the Typical Price | ||||
| RateOfReturn | (close – X period prior close) / X period prior close *100 | ||||
| Streak | returns the number of consecutive up or down periods, xlqxh.. may be calculated on different Types | ||||
| PercentRank | returns the percentile rank over the specified periods (default 100). May be calculated on different Types | ||||
| Aroon | |||||
| Aroon Up | Aroon Up based on high. | ||||
| Aroon Down | Aroon Down based on low. | ||||
| Aroon Oscillator | Difference between Aroon Up and Down | ||||
| ADX (Average Directional Index) | |||||
| DMPositive | The Positive Directional Movement. i.e. the largest portion of the periods range outside the previous periods range moving in a positive direction | ||||
| DMNegative | the Negative Directional Movement. i.e. the largest portion of the periods range outside the previous periods range moving in a negative direction | ||||
| DIPositive | The Positive Directional Indicator i.e. the positive directional movement / true range. | ||||
| DINegative | The Negative Directional Indicator i.e. the negative directional movement / true range. | ||||
| DMIPositive | The Positive Directional Movement Indicator i.e. an ema of the directional indicator (i.e. ema of DM+ / ema of True Range). | ||||
| DMINegative | The Negative Directional Movement Indicator i.e. an ema of the directional indicator (i.e. ema of DM- / ema of True Range). | ||||
| DX | The Directional Index i.e. (abs(DMI+ - DMI-)) / (DMI+ + DMI-) * 100 | ||||
| ADX | The Average Directional Index i.e. an ema of the DX. | ||||
| Bollinger Bands | xlqh.. | xlqxh.. | Week/Month | ||
| BollingerBandsUpper | The Upper band of the BB calculation. The default is 20 periods with stddev multiplier of 2, and may be calculated on different Types | ||||
| BollingerBandsMiddle | The Middle band of the BB calculation. Fractional Mulipliers may be used | ||||
| BollingerBandsLower | The Lower band of the BB calculation. | ||||
| BollingerBandsB | The %B Bollinger Bands calculation. | ||||
| BollingerBandsWidth | The bandwidth of the BB calculation. | ||||
|
Note: multiplier is entered as an integer but
fractions may be entered as follows:
values over 10 will be divided by 10, e.g. 21 will be 2.1 values over 100 will remove 100 and divide by 10, i.e. 121 will be 2.1 109 will be .9 values over 1000 will remove 1000 and divide by 100 i.e. 1210 will be 2.1, 1215 will be 2.15 |
|||||
| Bollinger Bands Version 2 with extra parameters | xlqh.. | xlqxh.. | Week/Month | ||
| BollingerBands2Upper | The Upper band of the BB calculation. The default is 20 periods with stddev multiplier of 2, and may be calculated on different Types | ||||
| BollingerBands2Middle | The Middle band of the BB calculation. Fractional Mulipliers may be used | ||||
| BollingerBands2Lower | The Lower band of the BB calculation. | ||||
| BollingerBands2B | The %B Bollinger Bands calculation. | ||||
| BollingerBands2Width | The bandwidth of the BB calculation. | ||||
|
Note: multiplier is entered as an integer but
fractions may be entered as follows:
values over 10 will be divided by 10, e.g. 21 will be 2.1 values over 100 will remove 100 and divide by 10, i.e. 121 will be 2.1 109 will be .9 values over 1000 will remove 1000 and divide by 100 i.e. 1210 will be 2.1, 1215 will be 2.15 |
|||||
| CCI (Commodity Channel Index) | |||||
| SMATPMD | mean deviation of the SMATP (sma of typical price) | ||||
| CCI | The Commodity Channel Index | ||||
| Choppiness Index | |||||
| Chop | Choppiness Index indicates whether the market is trending (not choppy) or ranging (choppy). | ||||
| CMB Composite Index | |||||
| CMBComposite | CMB (Constance Brown) Composite Index. | ||||
| CMBCompositeFast | Fast SMA of the CMB Composite Index. | ||||
| CMBCompositeSlow | Slow SMA of the CMB Composite Index. | ||||
| Connors RSI | |||||
| ConnorsRSI | Connors Relative Strength Index. Default RSI periods = 3, RSI Streak Periods = 2, Percent Rank periods = 100. | ||||
| ReverseConnorsRSI | returns the price required to obtain the target Connors RSI. Requires the number of periods for the rsi, the streak rsi the Percent Rank and the CRSI target. The Target should be entered as an integer. e.g. 60. If you would like to enter 60.5 use 605, or for 2 decimals 6055 for 60.55 | ||||
| Force Index | |||||
| ForceIndex | returns the Force index (default uses a 13 period ema) | ||||
| Fractal Dimension Index | |||||
| FractalDimension | returns the Fractal Dimension Index (usually 30 periods) | ||||
| Historic Volatility | xlqh.. | xlqxh.. | Week/Month | ||
| HistoricVolatility | returns the historic volatility. The default being for 30 periods and an annualized (252 day) scale factor. | ||||
| Kaufman Efficiency Ratio | |||||
| KaufmanER | Kaufman Efficiency Ratio. The default is 10 periods, and may be calculated on various Types | ||||
| Keltner Channels | |||||
| KeltnerChannelsLower | Returns the lower Keltner Channel. Default 20 Periods, 10 ATR periods, multiplier of 2, using an EMA
Fractional multipliers may be used - see BollingerBands for an example |
||||
| KeltnerChannelsMiddle | Returns the middle Keltner Channel. | ||||
| KeltnerChannelsUpper | Returns the upper Keltner Channel. | ||||
| Keltner Channels Version 2 with extra parameters | |||||
| KeltnerChannel2sLower | Returns the lower Keltner Channel. Default 20 Periods, 10 ATR periods, multiplier of 2, using an EMA
Fractional multipliers may be used - see BollingerBands for an example |
||||
| KeltnerChannels2Middle | Returns the middle Keltner Channel. | ||||
| KeltnerChannels2Upper | Returns the upper Keltner Channel. | ||||
| LSMA (Least Square Moving Average) also known as the linear regression value, moving linear regression and regression oscillator. | |||||
| LSMA | Least Square Moving Average. May be calculated on various Types | ||||
| Slope | Slope used in the LSMA | ||||
| MaxLSMA | Returns the Max of Least Square Moving Average for all periods between the 2 period ranges specified. The LSMA will be calculated for each and the maximum value for each result is returned | ||||
| MACD (Moving Average Convergence - Divergence) | xlqh.. | xlqxh.. | Week/Month | ||
| MACD | MACD (usually 26 / 12 period) | ||||
| MACDTrigger | X period EMA of MACD (default 9) | ||||
| MACDHistogram | Difference between MACD and MACDTrigger | ||||
| MACD (Moving Average Convergence - Divergence) Version 2 with extra parameters | xlqh.. | xlqxh.. | Week/Month | ||
| MACD2 | MACD2 (usually 26 / 12 period) | ||||
| MACD2Trigger | X period EMA of MACD (default 9) | ||||
| MACD2Histogram | Difference between MACD and MACDTrigger | ||||
| Money Flow Index | |||||
| MoneyFlowRaw | Raw Money Flow (Typical Price * Volume) | ||||
| MoneyFlowRatio | Money Flow Ratio | ||||
| MoneyFlowIndex | Money Flow Index | ||||
| On Balance Volume (OBV) | |||||
| OnBalanceVolume | (default 25) May be calculated on various Types and the result is also available as a Type parameter for other formulae | ||||
| PSAR (Parabolic Stop and Reverse) | |||||
| PSAR | Parabolic SAR (Stop and Reverse) Default acceleration factor 2% (.02), maximum step 20% (.2) | ||||
| PSARLongShort | If long, return 1, if short returns -1 | ||||
| PPO (Percentage Price Oscillator) | |||||
| PPO | the PPO (Percentage Price Oscillator) (usually 26 / 12 period) | ||||
| PPOTrigger | X period EMA of PPO (default 9) | ||||
| PPOHistogram | Difference between PPO and PPOTrigger | ||||
| RSI (Relative Strength Index) | |||||
| AveGain | Average of Gains over X periods | ||||
| AveLoss | Average of Losses over X periods | ||||
| RelativeStrength | Relative Strength, i.e. AveGain / AveLoss | ||||
| RSI | Relative Strength Index, i.e. RelativeStrength as a value between 0 and 100. | ||||
| ReverseRSI | the Reverse RSI, i.e. returns the price required to obtain the specified RSI. Requires no. of periods and target RSI. The Target should be entered as an integer. e.g. 60. If you would like to enter 60.5 use 605, or for 2 decimals 6055 for 60.55 | ||||
| RSI (Relative Strength Index) Version 2 with extra parameters | |||||
| AveGain2 | Average of Gains over X periods | ||||
| AveLoss2 | Average of Losses over X periods | ||||
| RelativeStrength2 | Relative Strength, i.e. AveGain / AveLoss | ||||
| RSI2 | Relative Strength Index, i.e. RelativeStrength as a value between 0 and 100. | ||||
| Stochastic Oscillator | xlqh.. | xlqxh.. | Week/Month | ||
| StochasticFastK | Stochastic %K (fast) for the x period (default 14) | ||||
| StochasticFastD | Stochastic %D (fast) the y period SMA of the stochastic %K (fast) (default 3) | ||||
| StochasticSlowK | Stochastic %K (slow) i.e. 3 period sma of the %K fast | ||||
| StochasticSlowD | Stochastic %D (slow) i.e. the y period moving average of the stochastic %K (slow) (default 3) | ||||
| StochasticFullK | Stochastic %K (full) i.e. y period sma of the %K fast | ||||
| StochasticFullD | Stochastic %D (full i.e. the z period moving average of the stochastic %K (full) (default 3) | ||||
| Super Trend | xlqh.. | xlqxh.. | Week/Month | ||
| SuperTrend | Super Trend by Olivier Seban (default 10). Can choose ATR calculation method | ||||
| TRIX (Triple eXponential moving average) | |||||
| TrixDbMA | the partial calculation of the Trix, i.e the double EMA or the EMA of the first EMA. | ||||
| TrixTrMA | the partial calculation of the Trix, i.e. the Triple EMA or the EMA of the double EMA. | ||||
| Trix | the Triple EMA (usually 15 period) | ||||
| TrixTrigger | X period EMA of Trix (default 9) | ||||
| TrixHistogram | Difference between Trix and TrixTrigger | ||||
| True Strength Index | |||||
| TrueStrengthIndex | the True Strength Index (usually 25 / 13 EMA periods). | ||||
| TrueStrengthSignal | X period EMA of True Strength Index (default 7). | ||||
| TrueStrengthHistogram | Difference between Index and Signal | ||||
| Up Down Volume Ratio | |||||
| UDVR | the Up Down Volume Ratio (usually 50 periods). | ||||
| UDVRSlope | Slope of the Up Down Volume Ratio. | ||||
| Vortex Indicator | |||||
| VortexPositive | the trend of the positive vortex (usually 14 period) | ||||
| VortexNegative | the trend of the negative vortex (usually 14 period) | ||||
| Williams %R Momentum Indicator | |||||
| WilliamsR | Williams %R Momentum Indicator (default 14) | ||||
| Dividends | Description | xlqh.. | xlqxh.. | Week/Month | |
| DividendDate | returns the ex dividend date | ||||
| DividendPaidDate | returns the dividend paid date | ||||
| DividendRecordDate | returns the dividend date of record | ||||
| DividendDeclaredDate | returns the date the dividend was declared | ||||
| DividendAmount | returns the dividend amount | ||||
| DividendAmountAdjusted | returns the adjusted dividend amount | ||||
| DividendFrankedPcnt | returns the dividend Franked Percent (Norgate-AU only) | ||||
| DividendType | returns the dividend type | ||||
| DividendCurrency | returns the currency | ||||
| DividendDateIndex | Get relative reference for a date | ||||
| DividendValidDateOrNext | Find the next date from reference | ||||
| Upcoming Dividends also returned for EODHD, FMP and Norgate | |||||
| Splits (EODHD and FMP) | Description | xlqh.. | xlqxh.. | Week/Month | |
| SplitDate | returns the split date | ||||
| SplitFactor | returns the split factor | ||||
| SplitReason | returns the split reason / ratio | ||||
| SplitDateIndex | Get relative reference for a date | ||||
| SplitValidDateOrNext | Find the next date from reference | ||||
| Upcoming Splits also returned for EODHD and FMP | |||||
| Target Price (EODHD) | Description | xlqh.. | xlqxh.. | Week/Month | |
| AnalystRating | returns the analyst rating | ||||
| AnalystTargetPrice | Analyst Target Price | ||||
| AnalystStrongBuy | Analyst Strong Buy | ||||
| AnalystBuy | Analyst Buy | ||||
| AnalystHold | Analyst Hold | ||||
| AnalystSell | Analyst Sell | ||||
| AnalystStrongSell | Analyst Strong Sell | ||||
| WallStreetTargetPrice | Wall Street Target Price | ||||
| Analyst Targets (FMP) | Description | xlqh.. | xlqxh.. | Week/Month | |
| AveTargetPriceLastMonth | returns the Average Target Price for Last Month | ||||
| AveTargetPriceLastQuarter | returns the Average Target Price for Last Quarter | ||||
| AveTargetPriceLastYear | returns the Average Target Price for Last Year | ||||
| AveTargetPriceLastAllTime | return the Average Target Price (All Time) | ||||
| AveTargetPriceLastMonthNoOfAnalysts | Number of Analysts for average last month target | ||||
| AveTargetPriceLastQuarterNoOfAnalysts | Number of Analysts for average last quarter target | ||||
| AveTargetPriceLastYearNoOfAnalysts | Number of Analysts for average last year target | ||||
| AveTargetPriceLastAllTimeNoOfAnalysts | Number of Analysts for average all time target | ||||
| TargetPublishers | List of Target Publishers | ||||
| Analyst Ratings (FMP) | Description | xlqh.. | xlqxh.. | Week/Month | |
| AnalystRatingsDate | returns the date of the analyst rating | ||||
| AnalystRatingsBuy | Number of Buy Ratings | ||||
| AnalystRatingsHold | Number of Hold Ratings | ||||
| AnalystRatingsSell | Number of Sell Ratings | ||||
| AnalystRatingsStrongBuy | Number of Strong Buy Ratings | ||||
| AnalystRatingsStrongSell | Number of Strong Sell Ratings | ||||
| AnalystRatingsDateIndex | Get relative reference for a date | ||||
| AnalystRatingsValidDateOrNext | Find the next date from reference | ||||
| Estimates (FMP) | Description | xlqh.. | xlqxh.. | Week/Month | |
| EstimatesDate | returns the date of Estimate | ||||
| EstimatesRevenueLow | Estimated Revenue Low | ||||
| EstimatesRevenueHigh | Estimated Revenue High | ||||
| EstimatesRevenueAvg | Estimated Revenue Average | ||||
| EstimatesEbitdaLow | Estimated Ebitda Low | ||||
| EstimatesEbitdaHigh | Estimated Ebitda High | ||||
| EstimatesEbitdaAvg | Estimated Ebitda Average | ||||
| EstimatesEbitLow | Estimated Ebit Low | ||||
| EstimatesEbitHigh | Estimated Ebit High | ||||
| EstimatesEbitAvg | Estimated Ebit Average | ||||
| EstimatesNetIncomeLow | Estimated Net Income Low | ||||
| EstimatesNetIncomeHigh | Estimated Net Income High | ||||
| EstimatesNetIncomeAvg | Estimated Net Income Average | ||||
| EstimatesSgaExpenseLow | Estimated Sga Expense Low | ||||
| EstimatesSgaExpenseHigh | Estimated Sga Expense High | ||||
| EstimatesSgaExpenseAvg | Estimated Sga Expense Average | ||||
| EstimatesEpsLow | Estimated Eps Low | ||||
| EstimatesEpsHigh | Estimated Eps High | ||||
| EstimatesEpsAvg | Estimated Eps Average | ||||
| EstimatesNumberAnalystEstimatedRevenue | No of Analyst Revenue | ||||
| EstimatesNumberAnalystsEstimatedEps | No of Analyst EPS | ||||
| EstimatesDateIndex | Get relative reference for a date | ||||
| EstimatesValidDateOrNext | Find the next date from reference | ||||
| Earnings Trend (EODHD) | Description | xlqh.. | xlqxh.. | Week/Month | |
| EarningsTrendFiscalEndDate | Fiscal End Date | ||||
| EarningsTrendPeriod | period | ||||
| EarningsTrendGrowth | Growth | ||||
| EarningsTrendEarningsEstimateAvg | Average Earnings Estimate | ||||
| EarningsTrendEarningsEstimateLow | Low Earnings Estimate | ||||
| EarningsTrendEarningsEstimateHigh | High Earnings Estimate | ||||
| EarningsTrendEarningsEstimateYearAgoEPS | Earnings Estimate Year Ago EPS | ||||
| EarningsTrendEarningsEstimateNumberOfAnalysts | Earnings Estimate Number Of Analysts | ||||
| EarningsTrendEarningsEstimateGrowth | Earnings Estimate Growth | ||||
| EarningsTrendRevenueEstimateAvg | Revenue Estimate Avg | ||||
| EarningsTrendRevenueEstimateLow | Revenue Estimate Low | ||||
| EarningsTrendRevenueEstimateHigh | Revenue Estimate High | ||||
| EarningsTrendRevenueEstimateYearAgoEPS | Revenue Estimate Year Ago EPS | ||||
| EarningsTrendRevenueEstimateNumberOfAnalysts | Revenue Estimate Number Of Analysts | ||||
| EarningsTrendRevenueEstimateGrowth | Revenue Estimate Growth | ||||
| EarningsTrendEPSTrendCurrent | EPS Trend Current | ||||
| EarningsTrendEPSTrend7DaysAgo | EPS Trend 7 Days Ago | ||||
| EarningsTrendEPSTrend30DaysAgo | EPS Trend 30 Days Ago | ||||
| EarningsTrendEPSTrend60DaysAgo | EPS Trend 60 Days Ago | ||||
| EarningsTrendEPSTrend90DaysAgo | EPS Trend 90 Days Ago | ||||
| EarningsTrendEPSRevisionsUpLast7Days | EPS Revisions Up Last 7 Days | ||||
| EarningsTrendEPSRevisionsUpLast30Days | EPS Revisions Up Last 30 Days | ||||
| EarningsTrendEPSRevisionsDownLast30Days | EPS Revisions Down Last 30 Days | ||||
| EarningsTrendEPSRevisionsDownLast90Days | EPS Revisions Down Last 90 Days | ||||
| EarningsTrendDateIndex | Get relative reference for a date | ||||
| EarningsTrendValidDateOrNext | Find the next date from reference | ||||
| Earnings Quarterly (EODHD and FMP) | Description | xlqh.. | xlqxh.. | Week/Month | |
| EarningsQFiscalEndDate | Fiscal date | ||||
| EarningsQReportDate | Report date | ||||
| EarningsQEPSActual | Actual eps for the earnings period | ||||
| EarningsQEPSEstimated | Estimated EPS | ||||
| EarningsQEPSSurprise | EPS surprise ($) for the earnings period | ||||
| EarningsQEstimatedChangePercent | Estimated EPS percent change | ||||
| EarningsQAnnounceTime | Announce Time | ||||
| EarningsQCurrency | Currency | ||||
| EarningsQDateIndex | Get relative reference for a date | ||||
| EarningsQValidDateOrNext | Find the next date from reference | ||||
| Upcoming Earnings also returned for EODHD and FMP | |||||
| Earnings Yearly (EODHD) | Description | xlqh.. | xlqh.. | Week/Month | |
| EarningsYFiscalEndDate | Fiscal date | ||||
| EarningsYEPSActual | Actual eps for the earnings period | ||||
| EarningsYDateIndex | Get relative reference for a date | ||||
| EarningsYValidDateOrNext | Find the next date from reference | ||||
| Insider Transactions (EODHD and FMP) | Description | xlqh.. | xlqh.. | Week/Month | |
| InsiderTransactionsDate | Insider Transactions Date | ||||
| InsiderTransactionsOwnerCIK | Insider Transactions Owner CIK | ||||
| InsiderTransactionsOwnerName | Insider Transactions Owner Name | ||||
| InsiderTransactionsTransactionDate | Insider Transactions Transaction Date | ||||
| InsiderTransactionsTransactionCode | Insider Transactions Transaction Code | ||||
| InsiderTransactionsTransactionAmount | Insider Transactions Transaction Amount | ||||
| InsiderTransactionsTransactionPrice | Insider Transactions Transaction Price | ||||
| InsiderTransactionsTransactionAcquiredDisposed | Insider Transactions Transaction Acquired Disposed | ||||
| InsiderTransactionsPostTransactionAmount | Insider Transactions Post Transaction Amount | ||||
| InsiderTransactionsSEClink | Insider Transactions SEC link | ||||
| InsiderTransactionsReportDate | Insider Transactions Report Date | ||||
| InsiderTransactionsOwnerRelationship | Insider Transactions Owner Relationship | ||||
| InsiderTransactionsOwnerTitle | Insider Transactions Owner Title | ||||
| InsiderTransactionsDateIndex | Get relative reference for a date | ||||
| InsiderTransactionsValidDateOrNext | Find the next date from reference | ||||
| Option Dates (EODHD) | Description | xlqh.. | xlqh.. | Week/Month | |
| OptionDateDate | Option Expiry Date | ||||
| OptionDateImpliedVolatility | Implied Volatility for Date | ||||
| xlqhOptionDatePutVolume | Implied Volatility for Date | ||||
| xlqhOptionDateCallVolume | Implied Volatility for Date | ||||
| xlqhOptionDatePutCallVolumeRatio | Implied Volatility for Date | ||||
| xlqhOptionDatePutOpenInterest | Implied Volatility for Date | ||||
| xlqhOptionDateCallOpenInterest | Implied Volatility for Date | ||||
| xlqhOptionDatePutCallOpenInterestRatio | Implied Volatility for Date | ||||
| OptionDateCount | Number of Stirkes for Date | ||||
| OptionDateDateIndex | relative reference of date | ||||
| OptionDateValidDateOrNext | Returns the next valid datee | ||||
| Can find the prior or next expiry date from a given date | |||||
| Option Strikes (EODHD) | Description | xlqh.. | xlqh.. | Week/Month | |
| OptionStrikeOnDate | referenced Strike On given Date | ||||
| OptionStrikeOnDateIndex | relative reference of strike price | ||||
| OptionValidStrikeOrNext | Returns the next valid strike price | ||||
| Can find the prior or next strike from a given price | |||||
| Option Strikes (EODHD) | Description | xlqh.. | xlqh.. | Week/Month | |
| Referenced by Date, Strike and Call / Put | |||||
| OptionDate | Returns the Date Referenced | ||||
| OptionStrike | Returns the Strike Referenced | ||||
| OptionCurrency | Returns the Currency | ||||
| OptionDaysBeforeExpiry | Returns the Number of Days Before Expiry | ||||
| OptionContractName | Returns the Option Contract Name | ||||
| xlqhOptionContractPeriod | Returns if it is weekly / monthly etc. | ||||
| OptionContractSize | Returns the Option Contract Size | ||||
| OptionInTheMoney | Indicates if Option is In The Money | ||||
| OptionLastTraderTime | Returns the Last Trader Time | ||||
| OptionLastPrice | Returns the Last Price | ||||
| OptionBid | Returns the Bid | ||||
| OptionAsk | Returns the Ask | ||||
| OptionMidpoint | Returns the Bid / Ask Midpoint | ||||
| OptionChange | Returns the Change | ||||
| OptionChangePercent | Returns the Change Percent | ||||
| OptionVolume | Returns the Volume | ||||
| OptionOpenInterest | Returns the Open Interest | ||||
| OptionImpliedVolatility | Returns the Implied Volatility | ||||
| OptionDelta | Returns the Delta | ||||
| OptionGamma | Returns the Gamma | ||||
| OptionTheta | Returns the Theta | ||||
| OptionVega | Returns the Vega | ||||
| OptionRho | Returns theRho | ||||
| OptionTheoretical | Returns the Theoretical Value | ||||
| OptionIntrinsicValue | Returns the Intrinsic Value | ||||
| OptionTimeValue | Returns the Time Value | ||||
| OptionUpdateTime | Returns the Update Time | ||||
| Can construct entire chains, example in xlq2Demo.xlsx | |||||
| Balance Sheet (EODHD and FMP) | Quarterly and Yearly | xlqhbsq.. | xlqhbsy.. | Week/Month | |
| FiscalDate | returns the fiscal date referenced | ||||
| ReportDate | returns the report date | ||||
| CurrentCash | Current Cash | ||||
| CashAndEquivalents | Cash And Equivalents | ||||
| ShorttermInvestments | Shortterm Investments | ||||
| CashAndShortTermInvestments | Cash And Short Term Investments | ||||
| Receivables | Receivables | ||||
| Inventory | Inventory | ||||
| OtherCurrentAssets | Other Current Assets | ||||
| CurrentAssets | Current Assets | ||||
| PropertyPlantEquipment | Property Plant and Equipment | ||||
| PropertyPlantAndEquipmentGross | Property Plant And Equipment Gross | ||||
| PropertyPlantEquipmentNet | Property Plant and Equipment Net | ||||
| Goodwill | Goodwill | ||||
| IntangibleAssets | Intangible Assets | ||||
| GoodwillAndIntangibleAssets | Goodwill And Intangible Assets | ||||
| LongtermInvestments | Long term Investments | ||||
| TaxAssets | Tax Assets | ||||
| NonCurrentAssetsOther | Non Current Assets Other | ||||
| NonCurrentAssetsTotal | Non Current Assets Total | ||||
| TotalAssets | Total Assets | ||||
| OtherAssets | Other Assets | ||||
| AccountsPayable | Accounts Payable | ||||
| ShortTermDebt | Short Term Debt | ||||
| TaxPayables | Tax Payables | ||||
| CurrentDeferredRevenue | Current Deferred Revenue | ||||
| OtherCurrentLiabilities | Other Current Liabilities | ||||
| TotalCurrentLiabilities | Total Current Liabilities | ||||
| CapitalLeaseObligations | Capital Lease bligations | ||||
| LongtermDebt | Long term Debt | ||||
| DeferredRevenueNonCurrent | Deferred Revenue Non Current | ||||
| DeferredLongTermLiabilites | Deferred Long Term Liabilites | ||||
| DeferredTaxLiabilitiesNonCurrent | Deferred Tax Liabilities Non Current | ||||
| NonCurrentLiabilitiesOther | Non Current Liabilities Other | ||||
| NonCurrentLiabilitiesTotal | Non Current Liabilities Total | ||||
| OtherLiabilities | Other Liabilities | ||||
| TotalLiabilities | Total Liabilities | ||||
| CommonStockTotalEquity | Common Stock Total Equity | ||||
| RetainedEarningsTotalEquity | Retained Earnings Total Equity | ||||
| PreferredStock | Preferred Stock | ||||
| CommonStock | Common Stock | ||||
| RetainedEarnings | Retained Earnings | ||||
| AccumulatedOtherComprehensiveIncome | Accumulated Other Comprehensive Income | ||||
| OtherStockholderEquity | Other Stockholder Equity | ||||
| ShareholderEquity | Shareholder Equity | ||||
| NetTangibleAssets | Net Tangible Assets | ||||
| LiabilitiesAndStockholdersEquity | Liabilities And Stockholders Equity | ||||
| MinorityInterest | Minority Interest | ||||
| TotalEquity | Total Equity | ||||
| TotalLiabilitiesAndTotalEquity | Total Liabilities And Total Equity | ||||
| TotalInvestments | Total Investments | ||||
| ShortLongTermDebtTotal | Short Long Term Debt Total | ||||
| NetDebt | Net Debt | ||||
| Currency | Currency | ||||
| Cik | Cik | ||||
| AcceptedDate | Accepte dDate | ||||
| CalendarYear | Calendar Year | ||||
| Period | Period | ||||
| Link | Link | ||||
| FinalLink | Final Link | ||||
| TreasuryStock | Treasury Stock | ||||
| CapitalSurplus | Capital Surplus | ||||
| CurrentLongtermDebt | Current Longterm Debt | ||||
| EarningAssets | Earning Assets | ||||
| TotalPermanentEquity | Total Permanent Equity | ||||
| NonControllingInterestInConsolidatedEntity | Non Controlling Interest In Consolidated Entity | ||||
| TemporaryEquityRedeemableNoncontrollingInterests | Temporary Equity Redeemable Noncontrolling Interests | ||||
| AdditionalPaidInCapital | Additional Paid In Capital | ||||
| PreferredStockTotalEquity | Preferred Stock Total Equity | ||||
| AccumulatedAmortization | Accumulated Amortization | ||||
| DeferredLongTermAssetCharges | Deferred Long Term Asset Charges | ||||
| LongTermDebtTotal | Long Term Debt Total | ||||
| NegativeGoodwill | Negative Goodwill | ||||
| Warrants | Warrants | ||||
| PreferredStockRedeemable | Preferred Stock Redeemable | ||||
| CapitalStock | Capital Stock | ||||
| AccumulatedDepreciation | Accumulated Depreciation | ||||
| CommonStockSharesOutstanding | Common Stock Shares Outstanding | ||||
| NetWorkingCapital | Net Working Capital | ||||
| NetInvestedCapital | Net Invested Capital | ||||
| DateIndex | Get relative reference for a date | ||||
| ValidDateOrNext | Find the next date from reference | ||||
| Income Statement (EODHD and FMP) | Quarterly and Yearly | xlqhisq.. | xlqhisy.. | Week/Month | |
| FiscalDate | returns the fiscal date referenced | ||||
| ReportDate | returns the report date | ||||
| TotalRevenue | Total Revenue | ||||
| CostOfRevenue | Cost Of Revenue | ||||
| GrossProfit | Gross Profit | ||||
| GrossProfitRatio | Gross Profit Ratio | ||||
| ResearchAndDevelopment | Research And Development | ||||
| GeneralAndAdministrativeExpenses | General And Administrative Expenses | ||||
| SellingAndMarketingExpenses | Selling And Marketing Expenses | ||||
| SellingGeneralAndAdmin | Selling General And Admin | ||||
| OtherOperatingExpenses | Other Operating Expenses | ||||
| OperatingExpense | Operating Expense | ||||
| CostAndExpenses | Cost And Expenses | ||||
| InterestIncome | Interest Income | ||||
| InterestExpense | Interest Expense | ||||
| DepreciationAndAmortization | Depreciation And Amortization | ||||
| Ebitda | Ebitda | ||||
| EbitdaRatio | Ebitda Ratio | ||||
| OperatingIncome | Operating Income | ||||
| OtherIncomeExpenseNet | Other Income Expense Net | ||||
| PretaxIncome | Pretax Income | ||||
| IncomeTax | Income Tax | ||||
| NetIncome | Net Income | ||||
| OperatingIncomeRatio | Operating Income Ratio | ||||
| IncomeBeforeTaxRatio | Income Before Tax Ratio | ||||
| NetIncomeRatio | Net Income Ratio | ||||
| EPS | EPS | ||||
| EPS Diluted | EPSDiluted | ||||
| WeightedAverageSharesOutstanding | Weighted Average Shares Outstanding | ||||
| WeightedAverageSharesOutstandingDiluted | Weighted Average Shares Outstanding Diluted | ||||
| Currency | Currency | ||||
| CIK | CIK | ||||
| AcceptedDate | Accepted Date | ||||
| CalendarYear | Calendar Year | ||||
| Period | Period | ||||
| Link | Link | ||||
| FinalLink | Final Link | ||||
| Ebit | Ebit | ||||
| MinorityInterest | Minority Interest | ||||
| EffectOfAccountingCharges | Effect Of Accounting Charges | ||||
| NonOperatingIncomeNetOther | Non Operating Income Net Other | ||||
| TaxProvision | Tax Provision | ||||
| NetInterestIncome | Net Interest Income | ||||
| ExtraordinaryItems | Extraordinary Items | ||||
| NonRecurring | Non Recurring | ||||
| Other Items | rCurrency | ||||
| DiscontinuedOperations | Discontinued Operations | ||||
| NetIncomeFromContinuingOps | Net Income From Continuing Ops | ||||
| NetIncomeApplicableToCommonShares | Net Income Applicable To Common Shares | ||||
| PreferredStockAndOtherAdjustments | Preferred Stock And Other Adjustments | ||||
| ReconciledDepreciation | Reconciled Depreciation | ||||
| DateIndex | Get relative reference for a date | ||||
| ValidDateOrNext | Find the next date from reference | ||||
| Cash Flow (EODHD and FMP) | Quarterly and Yearly | xlqhcfq.. | xlqhcfy.. | Week/Month | |
| FiscalDate | returns the fiscal date referenced | ||||
| ReportDate | returns the report date | ||||
| NetIncome | Net Income | ||||
| Depreciation | Depreciation | ||||
| DepreciationAndAmortization | Depreciation And Amortization | ||||
| DeferredIncomeTax | Deferred Income Tax | ||||
| StockBasedCompensation | Stock Based Compensation | ||||
| ChangeInWorkingCapital | Change In Working Capital | ||||
| ChangesInReceivables | Changes In Receivables | ||||
| ChangesInInventories | Changes In Inventories | ||||
| AccountsPayables | Accounts Payables | ||||
| CashFlowsOtherOperating | Cash Flows Other Operating | ||||
| OtherNonCashItems | Other Non Cash Items | ||||
| TotalCashFromOperatingActivities | Total Cash From Operating Activities | ||||
| InvestmentsInPropertyPlantAndEquipment | Investments In Property Plant And Equipment | ||||
| AcquisitionsNet | Acquisitions Net | ||||
| PurchasesOfInvestments | Purchases Of Investments | ||||
| SalesMaturitiesOfInvestments | Sales Maturities Of Investments | ||||
| OtherFinancingActivities | Other Financing Activities | ||||
| TotalInvestingCashflows | Total Investing Cashflows | ||||
| DebtRepayment | Debt Repayment | ||||
| CommonStockIssued | Common Stock Issued | ||||
| CommonStockRepurchased | Common Stock Repurchased | ||||
| DividendsPaid | Dividends Paid | ||||
| InvestingActivityOther | Investing Activity Other | ||||
| CashflowFinancing | Cashflow Financing | ||||
| ExchangerateEffect | Exchangerate Effect | ||||
| CashChange | Cash Change | ||||
| EndPeriodCashFlow | End Period Cash Flow | ||||
| BeginPeriodCashFlow | Begin Period Cash Flow | ||||
| OperatingCashFlow | Operating Cash Flow | ||||
| CapitalExpenditures | Capital Expenditures | ||||
| FreeCashFlow | Free Cash Flow | ||||
| Currency | Currency | ||||
| Cik | Cik | ||||
| AcceptedDate | Accepted Date | ||||
| CalendarYear | Calendar Year | ||||
| Period | Period | ||||
| Link | Link | ||||
| FinalLink | Final Link | ||||
| Investments | Investments | ||||
| NetBorrowings | Net Borrowings | ||||
| OtherFinancingCashflows | Other Financing Cashflows | ||||
| IssuanceOfCapitalStock | Issuance Of Capital Stock | ||||
| ChangeToLiabilities | Change To Liabilities | ||||
| ChangeToOperatingActivities | Change To Operating Activities | ||||
| ChangeToAccountReceivables | Change To Account eceivables | ||||
| SalePurchaseOfStock | Sale Purchase Of Stock | ||||
| ChangeToNetIncome | Change To Net Income | ||||
| CashAndCashEquivalentsChanges | Cash And Cash Equivalents Changes | ||||
| DateIndex | Get relative reference for a date | ||||
| ValidDateOrNext | Find the next date from reference | ||||
| Balance Sheet Growth (FMP) | Quarterly and Yearly | xlqhGrowthbsQ.. | xlqhGrowthbsY.. | Week/Month | |
| Date | returns the date referenced | ||||
| Period | returns the fiscal date | ||||
| CashAndCashEquivalents | Cash And Cash Equivalents | ||||
| ShortTermInvestments | Short Term Investments | ||||
| CashAndShortTermInvestments | Cash And Short Term Investments | ||||
| NetReceivables | Net Receivables | ||||
| Inventory | Inventory | ||||
| OtherCurrentAssets | Other Current Assets | ||||
| TotalCurrentAssets | Total Current Assets | ||||
| PropertyPlantEquipmentNet | Property Plant Equipment Net | ||||
| Goodwill | Goodwill | ||||
| IntangibleAssets | Intangible Assets | ||||
| GoodwillAndIntangibleAssets | Goodwill And Intangible Assets | ||||
| LongTermInvestments | Long Term Investments | ||||
| TaxAssets | Tax Assets | ||||
| OtherNonCurrentAssets | Other Non Current Assets | ||||
| TotalNonCurrentAssets | Total Non Current Assets | ||||
| OtherAssets | Other Assets | ||||
| TotalAssets | Total Assets | ||||
| AccountPayables | Account Payables | ||||
| ShortTermDebt | Short Term Debt | ||||
| TaxPayables | Tax Payables | ||||
| DeferredRevenue | Deferred Revenue | ||||
| OtherCurrentLiabilities | Other Current Liabilities | ||||
| TotalCurrentLiabilities | Total Current Liabilities | ||||
| LongTermDebt | Long Term Debt | ||||
| DeferredRevenueNonCurrent | Deferred Revenue Non Current | ||||
| DeferrredTaxLiabilitiesNonCurrent | Deferrred Tax Liabilities Non Current | ||||
| OtherNonCurrentLiabilities | Other Non Current Liabilities | ||||
| TotalNonCurrentLiabilities | Total Non Current Liabilities | ||||
| OtherLiabilities | Other Liabilities | ||||
| TotalLiabilities | Total Liabilities | ||||
| CommonStock | Common Stock | ||||
| RetainedEarnings | Retained Earnings | ||||
| AccumulatedOtherComprehensiveIncomeLoss | Accumulated Other Comprehensive Income Loss | ||||
| OtherTotalStockholdersEquity | Other Total Stockholders Equity | ||||
| TotalStockholdersEquity | Total Stockholders Equity | ||||
| TotalLiabilitiesAndStockholdersEquity | Total Liabilities And Stockholders Equity | ||||
| TotalInvestments | Total Investments | ||||
| TotalDebt | Total Debt | ||||
| NetDebt | Net Debt | ||||
| DateIndex | Get relative reference for a date | ||||
| ValidDateOrNext | Find the next date from reference | ||||
| Income Statement Growth (FMP) | Quarterly and Yearly | xlqhGrowthisQ.. | xlqhGrowthisY.. | Week/Month | |
| Date | returns the date referenced | ||||
| Period | returns the fiscal date | ||||
| Revenue | Revenue | ||||
| CostOfRevenue | Cost Of Revenue | ||||
| GrossProfit | Gross Profit | ||||
| GrossProfitRatio | Gross Profit Ratio | ||||
| ResearchAndDevelopmentExpenses | Research And Development Expenses | ||||
| GeneralAndAdministrativeExpenses | General And Administrative Expenses | ||||
| SellingAndMarketingExpenses | Selling And Marketing Expenses | ||||
| OtherExpenses | Other Expenses | ||||
| OperatingExpenses | Operating Expenses | ||||
| CostAndExpenses | Cost And Expenses | ||||
| InterestExpense | Interest Expense | ||||
| DepreciationAndAmortization | Depreciation And Amortization | ||||
| EBITDA | EBITDA | ||||
| EBITDARatio | EBITDA Ratio | ||||
| OperatingIncome | Operating Income | ||||
| OperatingIncomeRatio | Operating Income Ratio | ||||
| TotalOtherIncomeExpensesNet | Total Other Income Expenses Net | ||||
| IncomeBeforeTax | Income Before Tax | ||||
| IncomeBeforeTaxRatio | Income Before Tax Ratio | ||||
| IncomeTaxExpense | Income Tax Expense | ||||
| NetIncome | Net Income | ||||
| NetIncomeRatio | Net Income Ratio | ||||
| EPS | EPS | ||||
| EPSDiluted | EPS Diluted | ||||
| WeightedAverageShsOut | Weighted Average Shares Outstanding | ||||
| WeightedAverageShsOutDil | Weighted Average Shares Outstanding Diluted | ||||
| DateIndex | Get relative reference for a date | ||||
| ValidDateOrNext | Find the next date from reference | ||||
| Cash Flow Growth (FMP) | Quarterly and Yearly | xlqhGrowthcfQ.. | xlqhGrowthcfY.. | Week/Month | |
| Date | returns the date referenced | ||||
| Period | returns the fiscal date | ||||
| NetIncome | Net Income | ||||
| DepreciationAndAmortization | Depreciation And Amortization | ||||
| DeferredIncomeTax | Deferred Income Tax | ||||
| StockBasedCompensation | Stock Based Compensation | ||||
| ChangeInWorkingCapital | Change In Working Capital | ||||
| AccountsReceivables | Accounts Receivables | ||||
| Inventory | Inventory | ||||
| AccountsPayables | Accounts Payables | ||||
| OtherWorkingCapital | Other Working Capital | ||||
| OtherNonCashItems | Other Non Cash Items | ||||
| NetCashProvidedByOperatingActivites | Net Cash Provided By Operating Activites | ||||
| InvestmentsInPropertyPlantAndEquipment | Investments In Property Plant And Equipment | ||||
| AcquisitionsNet | Acquisitions Net | ||||
| PurchasesOfInvestments | Purchases Of Investments | ||||
| SalesMaturitiesOfInvestments | Sales Maturities Of Investments | ||||
| OtherInvestingActivites | Other Investing Activites | ||||
| NetCashUsedForInvestingActivites | Net Cash Used For Investing Activites | ||||
| DebtRepayment | Debt Repayment | ||||
| CommonStockIssued | Common Stock Issued | ||||
| CommonStockRepurchased | Common Stock Repurchased | ||||
| DividendsPaid | Dividends Paid | ||||
| OtherFinancingActivites | Other Financing Activites | ||||
| NetCashUsedProvidedByFinancingActivities | Net Cash Used Provided By Financing Activities | ||||
| EffectOfForexChangesOnCash | Effect Of Forex Changes On Cash | ||||
| NetChangeInCash | Net Change In Cash | ||||
| CashAtEndOfPeriod | Cash At End Of Period | ||||
| CashAtBeginningOfPeriod | Cash At Beginning Of Period | ||||
| OperatingCashFlow | Operating Cash Flow | ||||
| CapitalExpenditure | Capital Expenditure | ||||
| FreeCashFlow | Free Cash Flow | ||||
| DateIndex | Get relative reference for a date | ||||
| ValidDateOrNext | Find the next date from reference | ||||
| Financial Growth (FMP) | Quarterly and Yearly | xlqhGrowthFinQ.. | xlqhGrowthFinY.. | Week/Month | |
| Date | returns the date referenced | ||||
| Period | returns the fiscal date | ||||
| Revenue | Revenue | ||||
| GrossProfit | Gross Profit | ||||
| Ebit | Ebit | ||||
| OperatingIncome | Operating Income | ||||
| NetIncome | Net Income | ||||
| Eps | Eps | ||||
| EpsDiluted | Eps Diluted | ||||
| WeightedAverageShares | Weighted Average Shares | ||||
| WeightedAverageSharesDiluted | Weighted Average Shares Diluted | ||||
| DividendsperShare | Dividends per Share | ||||
| OperatingCashFlow | Operating Cash Flow | ||||
| FreeCashFlow | Free Cash Flow | ||||
| TenYRevenueGrowthPerShare | Ten Year Revenue Growth Per Share | ||||
| FiveYRevenueGrowthPerShare | Five Year Revenue Growth Per Share | ||||
| ThreeYRevenueGrowthPerShare | Three Year Revenue Growth Per Share | ||||
| TenYOperatingCFGrowthPerShare | Ten Year Operatin gCF Growth Per Share | ||||
| FiveYOperatingCFGrowthPerShare | Five Year Operating CF Growth Per Share | ||||
| ThreeYOperatingCFGrowthPerShare | Three Year Operating CF Growth Per Share | ||||
| TenYNetIncomeGrowthPerShare | Ten Year Net Income Growth Per Share | ||||
| FiveYNetIncomeGrowthPerShare | Five Year Net Income Growth Per Share | ||||
| ThreeYNetIncomeGrowthPerShare | Three Year Net Income Growth Per Share | ||||
| TenYShareholdersEquityGrowthPerShare | Ten Year Shareholders Equity Growth Per Share | ||||
| FiveYShareholdersEquityGrowthPerShare | Five Year Shareholders Equity Growth Per Share | ||||
| ThreeYShareholdersEquityGrowthPerShare | Three Year Shareholders Equity Growth Per Share | ||||
| TenYDividendperShareGrowthPerShare | Ten Year Dividend per Share Growth Per Share | ||||
| FiveYDividendperShareGrowthPerShare | Five Year Dividend per Share Growth Per Share | ||||
| ThreeYDividendperShareGrowthPerShare | Three Year Dividend per Share Growth Per Share | ||||
| Receivables | Receivables | ||||
| Inventory | Inventory | ||||
| Asset | Asset | ||||
| BookValueperShare | Book Value per Share | ||||
| Debt | Debt | ||||
| Rdexpense | Rd expense | ||||
| Sgaexpenses | Sga expenses | ||||
| DateIndex | Get relative reference for a date | ||||
| ValidDateOrNext | Find the next date from reference | ||||
| Key Metrics (FMP) | Quarterly, Yearly and TTM | xlqhKeyMetricsQ.. | xlqhKeyMetricsY.. | TTM (date = 0) |
|
| Date | returns the date referenced | ||||
| Period | returns the fiscal date | ||||
| RevenuePerShare | Revenue Per Share | ||||
| NetIncomePerShare | Net Income Per Share | ||||
| OperatingCashFlowPerShare | Operating Cash Flow Per Share | ||||
| FreeCashFlowPerShare | Free Cash Flow Per Share | ||||
| CashPerShare | Cash Per Share | ||||
| BookValuePerShare | Book Value Per Share | ||||
| TangibleBookValuePerShare | Tangible Book Value Per Share | ||||
| ShareholdersEquityPerShare | Shareholders Equity Per Share | ||||
| InterestDebtPerShare | Interest Debt Per Share | ||||
| MarketCap | Market Cap | ||||
| EnterpriseValue | Enterprise Value | ||||
| PeRatio | Pe Ratio | ||||
| PriceToSalesRatio | Price To Sales Ratio | ||||
| Pocfratio | Pocf ratio | ||||
| PfcfRatio | Pfcf Ratio | ||||
| PbRatio | Pb Ratio | ||||
| PtbRatio | Ptb Ratio | ||||
| EvToSales | Ev To Sales | ||||
| EnterpriseValueOverEBITDA | Enterprise Value Over EBITDA | ||||
| EvToOperatingCashFlow | Ev To Operating Cash Flow | ||||
| EvToFreeCashFlow | Ev To Free Cash Flow | ||||
| EarningsYield | Earnings Yield | ||||
| FreeCashFlowYield | Free Cash Flow Yield | ||||
| DebtToEquity | Debt To Equity | ||||
| DebtToAssets | Debt To Assets | ||||
| NetDebtToEBITDA | Net Debt To EBITDA | ||||
| CurrentRatio | Current Ratio | ||||
| InterestCoverage | Interest Coverage | ||||
| IncomeQuality | Income Quality | ||||
| DividendYield | Dividend Yield | ||||
| PayoutRatio | Payout Ratio | ||||
| SalesGeneralAndAdministrativeToRevenue | Sales General AndA dministrative To Revenue | ||||
| ResearchAndDevelopementToRevenue | Research And Developement To Revenue | ||||
| IntangiblesToTotalAssets | Intangibles To Total Assets | ||||
| CapexToOperatingCashFlow | Capex To Operating Cash Flow | ||||
| CapexToRevenue | Capex To Revenue | ||||
| CapexToDepreciation | Capex To Depreciation | ||||
| StockBasedCompensationToRevenue | Stock Based Compensation To Revenue | ||||
| GrahamNumber | Graham Number | ||||
| Roic | Roic | ||||
| GrahamNetNet | Graham Net Net | ||||
| WorkingCapital | Working Capital | ||||
| TangibleAssetValue | Tangible Asset Value | ||||
| NetCurrentAssetValue | Net Current Asset Value | ||||
| InvestedCapital | Invested Capital | ||||
| AverageReceivables | Average Receivables | ||||
| AveragePayables | Average Payables | ||||
| AverageInventory | Average Inventory | ||||
| Days SalesOutstanding | Days Sales Outstanding | ||||
| DaysPayablesOutstanding | Days Payables Outstanding | ||||
| DaysOfInventoryOnHand | Days Of Inventory On Hand | ||||
| ReceivablesTurnover | Receivables Turnover | ||||
| PayablesTurnover | Payables Turnover | ||||
| InventoryTurnover | Inventory Turnover | ||||
| Roe | Roe | ||||
| CapexPerShare | Capex Per Share | ||||
| DateIndex | Get relative reference for a date | ||||
| ValidDateOrNext | Find the next date from reference | ||||
| Financial Ratios (FMP) | Quarterly, Yearly and TTM | xlqhKeyMetricsQ.. | xlqhKeyMetricsY.. | TTM (date = 0) |
|
| Date | returns the date referenced | ||||
| Period | returns the fiscal date | ||||
| CurrentRatio | Current Ratio | ||||
| QuickRatio | Quick Ratio | ||||
| CashRatio | Cash Ratio | ||||
| DaysOfSalesOutstanding | Days Of Sales Outstanding | ||||
| DaysOfInventoryOutstanding | Days Of Inventory Outstanding | ||||
| OperatingCycle | Operating Cycle | ||||
| DaysOfPayablesOutstanding | Days Of Payables Outstanding | ||||
| CashConversionCycle | Cash Conversion Cycle | ||||
| GrossProfitMargin | Gross Profit Margin | ||||
| OperatingProfitMargin | Operating Profit Margin | ||||
| PretaxProfitMargin | Pretax Profit Margin | ||||
| NetProfitMargin | Net Profit Margin | ||||
| EffectiveTaxRate | Effective Tax Rate | ||||
| ReturnOnAssets | Return O nAssets | ||||
| ReturnOnEquity | Return On Equity | ||||
| ReturnOnCapitalEmployed | Return On Capital Employed | ||||
| NetIncomePerEBT | Net Income Per EBT | ||||
| EbtPerEbit | Ebt Per Ebit | ||||
| EbitPerRevenue | Ebit Per Revenue | ||||
| DebtRatio | Debt Ratio | ||||
| DebtEquityRatio | Debt Equity Ratio | ||||
| LongTermDebtToCapitalization | Long Term Debt To Capitalization | ||||
| TotalDebtToCapitalization | Total Debt To Capitalization | ||||
| InterestCoverage | Interest Coverage | ||||
| CashFlowToDebtRatio | Cash Flow To Debt Ratio | ||||
| CompanyEquityMultiplier | Company Equity Multiplier | ||||
| ReceivablesTurnover | Receivables Turnover | ||||
| PayablesTurnover | Payables Turnover | ||||
| InventoryTurnover | Inventory Turnover | ||||
| FixedAssetTurnover | Fixed Asset Turnover | ||||
| AssetTurnover | Asset Turnover | ||||
| OperatingCashFlowPerShare | Operating Cash Flow Per Share | ||||
| FreeCashFlowPerShare | Free Cash Flow Per Share | ||||
| CashPerShare | Cash Per Share | ||||
| PayoutRatio | Payout Ratio | ||||
| OperatingCashFlowSalesRatio | Operating Cash Flow Sales Ratio | ||||
| FreeCashFlowOperatingCashFlowRatio | Free Cash Flow Operating Cash Flow Ratio | ||||
| CashFlowCoverageRatios | Cash Flow Coverage Ratios | ||||
| ShortTermCoverageRatios | Short Term Coverage Ratios | ||||
| CapitalExpenditureCoverageRatio | Capital Expenditure Coverage Ratio | ||||
| DividendPaidAndCapexCoverageRatio | Dividend Paid And Capex Coverage Ratio | ||||
| DividendPayoutRatio | Dividend Payout Ratio | ||||
| PriceBookValueRatio | Price Book Value Ratio | ||||
| PriceToBookRatio | Price To Book Ratio | ||||
| PriceToSalesRatio | Price To Sales Ratio | ||||
| PriceEarningsRatio | Price Earnings Ratio | ||||
| PriceToFreeCashFlowsRatio | Price To Free Cash Flows Ratio | ||||
| PriceToOperatingCashFlowsRatio | Price To Operating Cash Flows Ratio | ||||
| PriceCashFlowRatio | Price Cash Flow Ratio | ||||
| PriceEarningsToGrowthRatio | Price Earnings To Growth Ratio | ||||
| PriceSalesRatio | Price Sales Ratio | ||||
| DividendYield | Dividend Yield | ||||
| Enterprise Value Multiple | returns the fiscal date | ||||
| PriceFairValue | Price Fair Value | ||||
| DateIndex | Get relative reference for a date | ||||
| ValidDateOrNext | Find the next date from reference | ||||
| Indexes and Constituents (Norgate and EODHD) | Description | xlqh.. | xlqxh.. | Week/Month | |
| IsMemberOfIndex | returns Yes/No to test if a symbol is part of a specific index. Can also test if symbol was a member in the past. | ||||
| IsMemberOfIndexOnDate | returns Yes/No to test if a symbol was a part of an index on a specific date. | ||||
| IndexConstituentCount | returns a total symbols count for an index (current or including historic) | ||||
| IndexConstituentSymbol | returns the constituent symbols of an index (current or including historic) | ||||
| MemberOfIndexCount | returns the number of indexes that a symbol is a member (current or including historic) | ||||
| MemberOfIndexSymbol | returns the index symbols for which the symbol is a member (current or including historic) | ||||
| EODHD Extra | Description | xlqh.. | xlqxh.. | Week/Month | |
| Name | Name | ||||
| Exchange | Exchange | ||||
| DescriptionLong | Long text description | ||||
| AssetType | Asset Type | ||||
| Currency | Currency | ||||
| CurrencyName | Currency Name | ||||
| CurrencySymbol | Currency Symbol | ||||
| CountryName | Country Name | ||||
| CountryISO | Country ISO | ||||
| ISIN | ISIN | ||||
| CUSIP | CUSIP | ||||
| CIK | CIK | ||||
| EmployerIDNumber | Employer ID Number | ||||
| FiscalYearEnd | Fiscal Year End | ||||
| IPO Date | IPODate | ||||
| International Domestic | International / Domestic | ||||
| Sector | Sector | ||||
| Industry | Industry | ||||
| GICSector | GIC Sector | ||||
| GICGroup | GIC Group | ||||
| GICIndustry | GIC Industry | ||||
| GICSubIndustry | GIC Sub Industry | ||||
| HomeCategory | Home Category | ||||
| IsDelisted | Is Delisted | ||||
| Phone | Phone | ||||
| Website | Website | ||||
| LogoURL | LogoURL | ||||
| CEO | CEO | ||||
| AddressStreet | Address Street | ||||
| AddressCity | Address City | ||||
| AddressCountry | Address Country | ||||
| AddressZip | Address Zip | ||||
| EODHDUpdateDate | EODHD Update Date | ||||
| NoOfEmployees | No Of Employees | ||||
| MarketCap | Market Cap | ||||
| MarketCapMln | Market Cap Mln | ||||
| EBITDA | EBITDA | ||||
| PERatio | PERatio | ||||
| PEGRatio | PEGRatio | ||||
| WallStreetTargetPrice | WallStreetTargetPrice | ||||
| BookValue | BookValue | ||||
| DividendShare | Dividend Share | ||||
| DividendYield | Dividend Yield | ||||
| EPS | EPS | ||||
| EPSEstimateCurrentYear | EPS Estimate Current Year | ||||
| EPSEstimateNextYear | EPS Estimate Next Year | ||||
| EPSEstimateNextQuarter | EPS Estimate Next Quarter | ||||
| EPSEstimateCurrentQuarter | EPS Estimate Current Quarter | ||||
| MostRecentQuarter | Most Recent Quarter | ||||
| ProfitMargin | Profit Margin | ||||
| OperatingMarginTTM | Operating Margin TTM | ||||
| ReturnOnAssetsTTM | Return On Assets TTM | ||||
| ReturnOnEquityTTM | Return On Equity TTM | ||||
| RevenueTTM | Revenue TTM | ||||
| RevenuePerShareTTM | Revenue Per Share TTM | ||||
| QuarterlyRevenueGrowthYOY | Quarterly Revenue Growth YOY | ||||
| GrossProfitTTM | Gross Profit TTM | ||||
| DilutedEpsTTM | Diluted Eps TTM | ||||
| QuarterlyEarningsGrowthYOY | Quarterly Earnings Growth YOY | ||||
| TrailingPE | Trailing PE | ||||
| ForwardPE | ForwardPE | ||||
| PriceSalesTTM | Price Sales TTM | ||||
| PriceBookMRQ | Price Book MRQ | ||||
| EnterpriseValueRevenue | Enterprise Value Revenue | ||||
| EnterpriseValueEbitda | Enterprise Value Ebitda | ||||
| SharesOutstanding | Shares Outstanding | ||||
| Float | Float | ||||
| PercentInsiders | Percent Insiders | ||||
| PercentInstitutions | Percent Institutions | ||||
| SharesShort | Shares Short | ||||
| SharesShortPriorMonth | Shares Short Prior Month | ||||
| ShortRatio | Short Ratio | ||||
| ShortPercentOutstanding | Short Percent Outstanding | ||||
| ShortPercentFloat | Short Percent Float | ||||
| Beta | Beta | ||||
| Week52high | Week 52 high | ||||
| Week52low | Week 52 low | ||||
| Day200MovingAvg | Day 200 Moving Avg | ||||
| Day50MovingAvg | Day 50 Moving Avg | ||||
| xDividendRate | Dividend Rate | ||||
| Next Dividend Pay Date | Payout Ratio | ||||
| NextExDividendDate | Next Ex Dividend Date | ||||
| LastSplitFactor | Last Split Factor | ||||
| LastSplitDate | Last Split Date | ||||
| Bonds (extra formulae for) | |||||
| BondYield | Bond Yield (daily) | ||||
| WKN | Wertpapierkennnummer | ||||
| Sedol | Sedol | ||||
| FIGI | Financial Instrument Global Identifier | ||||
| BondType | Bond Type | ||||
| DebtType | Debt Type | ||||
| SubProductAsset | Sub Product Asset | ||||
| Sub Product Asset Type | SubProductAssetType | ||||
| MoodyRating | Moody Rating | ||||
| MoodyRatingUpdateDate | Moody Rating Update Date | ||||
| SPRating | Standard & Poors Credit Rating | ||||
| SPRatingUpdateDate | SP Rating Update Date | ||||
| Coupon | Coupon | ||||
| LastPrice | Last Price | ||||
| LastTradeDate | Last Trade Date | ||||
| MaturityDate | Maturity Date | ||||
| YieldToMaturity | Yield To Maturity | ||||
| Callable | Callable | ||||
| NextCallDate | Next Call Date | ||||
| MinimumSettlementAmount | Minimum Settlement Amount | ||||
| ParIntegralMultiple | Par Integral Multiple | ||||
| IssueDate | Issue Date | ||||
| OfferingDate | Offering Date | ||||
| FirstCouponDate | First Coupon Date | ||||
| FirstTradingDay | First Trading Day | ||||
| CouponPaymentFrequency | Coupon Payment Frequency | ||||
| Cryptos (extra formulae for) | |||||
| MarketCapitalizationDiluted | Market Cap Diluted | ||||
| CirculatingSupply | Circulating Supply | ||||
| TotalSupply | Total Supply | ||||
| MaxSupply | Max Supply | ||||
| MarketCapDominance | Market Ca pDominance | ||||
| LowAllTime | Alltime Low | ||||
| HighAllTime | Alltime High | ||||
| ETFs (extra formulae for) | |||||
| Yield | Yield | ||||
| DividendPayingFrequency | Dividend Paying Frequency | ||||
| InceptionDate | Inception Date | ||||
| OngoingCharge | Ongoing Charge | ||||
| OngoingChargeDate | Ongoing Charge Date | ||||
| ExpenseRatio | Expense Ratio | ||||
| AnnualHoldingsTurnover | Annual Holdings Turnover | ||||
| TotalAssets | Total Assets | ||||
| AverageMktCapMil | Average MktCap Mil | ||||
| Mutual Funds (extra formulae for) | |||||
| Category | Category | ||||
| Style | Style | ||||
| NAV | NAV | ||||
| PortfolioNetAssets | Portfolio Net Assets | ||||
| ShareClassNetAssets | Share Class Net Assets | ||||
| InceptionDate | Inception Date | ||||
| Yield | Yield | ||||
| YieldYTD | Yield YTD | ||||
| Yield1YearYTD | Yield 1Year YTD | ||||
| Yield3YearYTD | Yield 3Year YTD | ||||
| Yield5YearYTD | Yield 5Year YTD | ||||
| ExpenseRatio | ExpenseRatio | ||||
| ExpenseRatioDate | Expense Ratio Date | ||||
| FMP Extra | Description | xlqh.. | xlqxh.. | Week/Month | |
| Name | returns the name | ||||
| Exchange | returns the exchange | ||||
| DescriptionLong | Long text description | ||||
| Currency | Currency | ||||
| CountryName | Country Name | ||||
| ISIN | ISIN | ||||
| CUSIP | CUSIP | ||||
| CIK | CIK | ||||
| IPODate | IPO Date | ||||
| Sector | Sector | ||||
| Industry | Industry | ||||
| Phone | Phone | ||||
| Website | Website | ||||
| LogoURL | Logo URL | ||||
| Ceo | Ceo | ||||
| AddressStreet | Street | ||||
| AddressCity | City | ||||
| AddressZip | Zip | ||||
| NoOfEmployees | No Of Employees | ||||
| MarketCap | Market Cap | ||||
| Norgate Extra | Description | xlqh.. | xlqxh.. | Week/Month | |
| Name | returns the name | ||||
| Exchange | returns the exchange | ||||
| Description | returns a description | ||||
| DescriptionLong | Long text description | ||||
| FirstDate | returns the first available date | ||||
| LastDate | returns the last date available | ||||
| RecordCount | returns the number of records / periods | ||||
| AssetType | returns an asset type description | ||||
| GICS | returns the Global Industry Classification Standard code | ||||
| Currency | returns the trading currency | ||||
| DividendRate | returns the dividend rate | ||||
| EPS | returns the latest EPS | ||||
| FrankedPcnt | returns the Franked Percent (AU only) | ||||
| ExpiryDate | returns the expiry date (AU only) | ||||
| ExercisePrice | returns the exercise price (AU only) | ||||
| ExerciseType | returns the exercise type (AU only) | ||||
| SharesPerContract | returns the no. of shares per contract (AU only) | ||||
| Issue | Issue | ||||
| Norgate | returns over 150 different financial / fundamental values depending on parameter such as beta, float, shares outstanding, revenue per share... | ||||
| Other | Description | xlqh.. | xlqxh.. | Week/Month | |
| Symbol | returns the symbol referenced by a numeric value !1, !2 for loop processing | ||||
| SymbolCount | returns the number of symbols currently in xlq for the source | ||||
| Description | xlqh.. | xlqxh.. | Week/Month | ||
Range Formulae
Start with =xlqRh, allow for 2 date reference parameters. All are also available in week and month formats.
| Included with xlq2Lite and xlq2 | |
| RateOfReturn | Rate of return (%Change) between the start and end dates specified |
| StdDev | Standard deviation (sample) given a start and end date. May be calculated on different Types |
| StdDevP | Standard deviation (population) given a start and end date. May be calculated on different Types |
| Mean | Simple moving average given a start and end date. May be calculated on different Types |
| Median | The median given a start and end date. May be calculated on different Types |
| HighestClose | Highest close within a range of dates |
| LowestCLose | Lowest close within a range of dates |
| HighestHigh | Highest high within a range of dates |
| LowestLow | Lowest low within a range of dates |
| HighestCloseDate | Date of the highest close within a range of dates |
| LowestCloseDate | Date of the lowest close within a range of dates |
| HighestHighDate | Date of the highest high within a range of dates |
| LowestLowDate | Date of the lowest low within a range of dates |
| HighestVolume | Highest volume within a range of dates |
| LowestVolume | Date of the lowest volume within a range of dates |
| HighestVolumeDate | Date of the highest volume within a range of dates |
| LowestVolumeDate | Date of the lowest volume within a range of dates |
| AveVolume | Average (SMA) volume within a range of dates |
| TotalVolume | Total or sum of each periods volume within a range of dates |
| DrawDownFromHighest | Returns the % drawdown from the highest value in the period range to the end value. May be calculated on different Types. When Close is specified, the drawdown will be from the highest close in the range to the last close of the range. For the other values, it will be from the highest value to the low, e.g. from the highest typical price in the series to the low of the last period. |
| MaxDrawDownFromHighest | Calculates the % DrawDown for each period in the range, and return the highest value calculated within the series |
| DrawUpFromLowest | Returns the % drawup from the lowest value in the period range to the end value. May be calculated on different Types. When Close is specified, the drawup will be from the lowest close in the range to the last close of the range. For the other values, it will be from the lowest value to the high. |
| MaxDrawUpFromLowest | Calculates the % DrawUp for each period in the range, and return the highest value calculated within the series |
| Included with xlq2 | |
| TotalDividends | Total or sum of dividends paid within a range of dates |
| TotalDividendsAdjusted | Total or sum of dividends paid within a range of dates (split adjusted) |
Types
For any formula using a Type parameter, the following are available:
| 0 | Close |
| 1 | Open |
| 2 | Low |
| 3 | High |
| 4 | Typical Price i.e. (high + low + close) / 3 |
| 5 | Weighted Price i.e. (open + high + low + close) / 4 |
| 6 | Rate of Return (%Change) |
| 7 | Range i.e. High - Low |
| 8 | True Range |
| 9 | ATR%, i.e. x period ATR as specified in preferences as a % of the last periods close |
| 10 | CLOP (close - open) |
| 11 | CLOP% (close - open)/open |
| 12 | HIOP (high - open) |
| 13 | HIOP% (high - open)/open |
| 14 | LOOP (low - open) |
| 15 | LOOP% (low - open)/open |
| 16 | CLLO (close - low) |
| 17 | CLLO% (close - low) / low |
| 18 | CLHI (close - high) |
| 19 | CLHI% (close - high) / high |
| 20 | Volume |
| 21 | On Balance Volume |
| 22 | Close Price * Volume |
Flex Average Types
The Following Types may be used for the Flex. Average, Slope, Intercept and StdDev:
| 0 | SMA (Simple Moving Average) |
| 1 | EMA (Exponential Moving Average) |
| 2 | DEMA (Double Exponential Moving Average) |
| 3 | TEMA (Triple Exponential Moving Average) |
| 4 | TrEMA (Triangular Exponential Moving Average) |
| 5 | Wilder Moving Average |
| 6 | Weighted Moving Average |
| 7 | Volume Weighted Moving Average |
| 8 | Hull Moving Average |
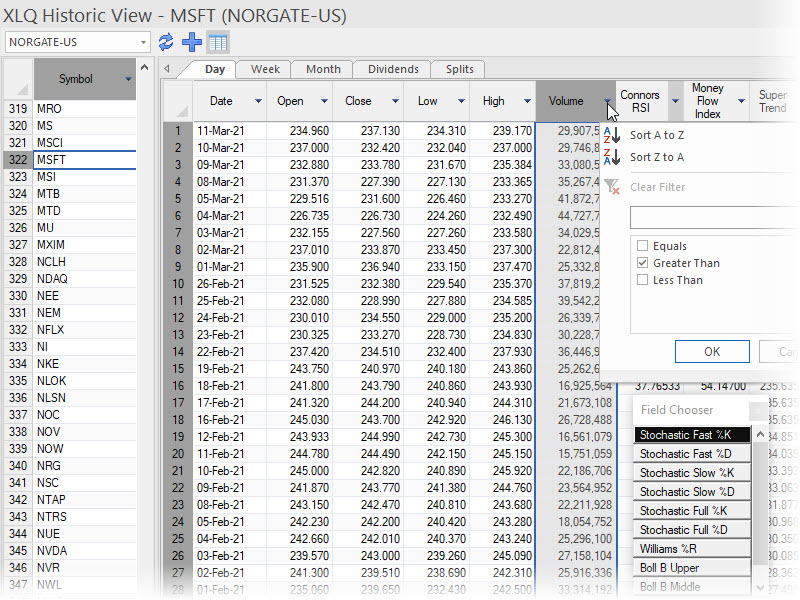
XLQ view
It is also possible to view the historic data directly in xlq
Right click the Q on the task bar (or press alt-ctrl-shift-Q) and choose View data / Historic View
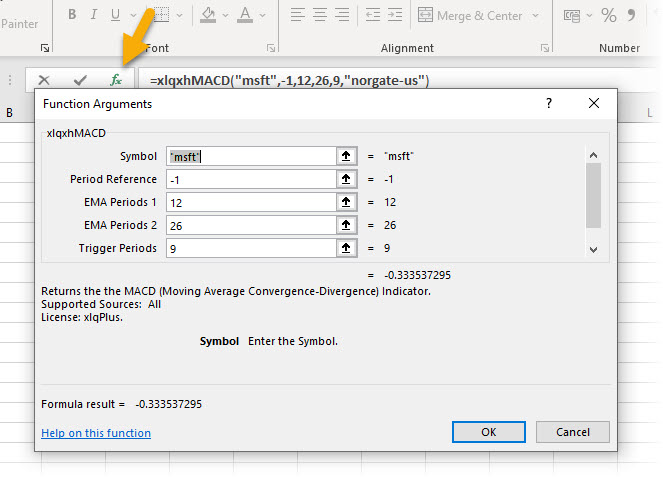
Examples
For additional information on parameters press excel's insert function button 'fx' and select the parameter
Open Example
=xlqhOpen("gs",-1,"tda") will return the last (yesterday or prior trading days) opening price for GS from TDAmeritrade
=xlqhOpen("gs",-10) will return the opening price from 10 trading days ago for GS from the default historic data source (set it xlq preferences)
=xlqhOpen("csco","10/30/2014","iqfeed") will return the opening price for 30 October 2014 for CSCO from IQFeed
=xlqhwOpen("csco",-2,"ib") will return the opening price for last week for CSCO from InteractiveBrokers
=xlqhmOpen("amzn",-12,"yahoo") will return the opening price for 12 months ago for AMZN from Yahoo
=xlqhmOpen("amzn",-1,"yahoo") will return the opening price for the current partial month for AMZN from Yahoo
=xlqhOpen(A1,B1,C1) will return the open for the symbol in cell A1, date in cell B1, and source in cell C1
=xlqFx("xlqhOpen","gs","tda",-1) alternative way of entering formula using xlqfx
Mean Example
=xlqxhMean("ibm",-1,5,0,"norgate-us") will return a 5 days simple moving average of the closing price (type 0) as per the last close for IBM from Norgate.
=xlqxhMean("ibm",-10,15,1,"eodhd") will return a 15 days simple moving average of the opening price (type 1) for the period 10 trading days ago for IBM from EODHD.
=xlqxhmMean("aapl",-2,12,2,"tda") will return a 12 month average for the low price of the month up to and including the last full month for AAPL from TDA
=xlqxhMean("aapl",0,20,4,"ib") will return a 20 day average of the typical price (high+low+close)/3 up to and including the real-time price, high and low of the current trading day for AAPL from InteractiveBrokers
=xlqxhMean("cim","31/03/2015",25,0,"iqfeed") will return a 25 day average of the close price as on the 31 march 2015 for CIM from IQfeed
=xlqrhMean("csco",-10,-1) using the range version will return the average from 10 days ago till the last close for the close form the default data source
=xlqrhMean("csco","01/01/2015",-1,3,"iqfeed") will return the average daily high since the start of the year 2015 till (and including) the last close for csco from iqfeed.
=xlqFx("xlqrhMean","csco","iqfeed","01/01/2015",-1,3)alternative way of entering previous formula using xlqfx
Additional examples of all formulae in xlqDemo.xls included with the download.
New Tips and Tricks Page
- A quick reference guide to using xlq with excel including shortcuts, tips etc.
- Examples and explanations for all user levels.
Also available via the Resource menu above, along with references for formulae, symbols etc.
LATEST NEWS:
5 December 2023
XLQ2 23.7 released
-
Financial Modeling Prep (FMP) added as new source
- covers Multiple markets
- Realtime Snapshot data
- Historic day / week / month (may be dividend adjusted)
- Financials
- Earnings
- Dividends, splits
- Historic intraday
- Insider transactions
Subscriptions start at $14.25 per month
- Yahoo - xlqhName and xlqhExchange are now supported.
- Tiingo - xlqName and xlqExchange are now supported.
- More. >>
Current Offers
1 year of upgrades included
Purchase xlq2Lite for $159
Purchase xlq2 for $299
Pleased with the service and support
or feel extra has been earned?
Your acknowledgement is appreciated.
Thank you
User Comments
It is so uncommon in this day and age to receive top-level, human support and I appreciate that immensely. The quality, breadth and utility of your product is incredible, but even more impressive is the level of support you provided to me, just one individual customer. You may quote me on that. Thank you.
- C.B.
Wow, you did a lot of work on this version. New interface and other things as well. I must give you credit for being the most responsive software engineer that I've ever encountered. Every question that I've sent you over the many years (since 2003!!!) has been answered quickly and professionally. I just wanted to let you know that it is appreciated.
- M.N.
I have to say Leo that the last two versions have made some tremendous improvements to what has been for years an outstanding application. Thank you for your continued efforts.
- C.A.
Just to let you know that, the new version works much better & faster than the older one. I like it a lot, fantastic job you did!!!
- R.S.
Many thanks indeed for your clear and very rapid reply. I am not used to this type of quality service - I thought it went out of fashion years ago !!
- P.G.
In only 40 some days XLQ has helped me with a number of research projects I couldn't possibly have done without it and I'm now using it to help manage and track current trades and to alert me to potential new trades.
- D.P.
I just wanted to take a moment and thank you for creating XLQ. I use it regularly for scanning/monitoring securities in Excel 2007. I have programmed in trailing stops for securities I own and numerous techniques using indicators for securities on my watch list. The combination of Excel 2007 and XLQ has opened up nearly an unlimited capability that is only constrained by my imagination.
- E.H.
Thank you for the amazing package -- I use it daily and it's ridiculously useful! Others (.....) have added some of the features you have, but none of them even comes close to matching what you've built.
- R.B.
Your product is fantastic, amazing, and really strong. It has real enabling capability. Thank you for putting this into the market!
- R.G.
You have an exceptional customer service, you have always answered my questions, I thank you for that, made it really easy to use this software, will be your long term customer. Thanks.
- A.D.
I was halfway resigned to have to program something like this myself. Only it would have taken me forever, and I couldn't have done it half as well. Thanks!
- M.S.
I also want to thank you for making the XLQ program. It is something that is very useful and incredible helpful. Like it was made for my needs.
- J.T.
I have already modified your demo sheet to fit my needs. Your program allows me to turn my excel spreadsheet into a total information center that updates automatically. It's elegant.
- W.H.
First, I want to say that your program is probably the finest piece of work I have ever seen. The depth is simply amazing. Congratulations and thanks.
- D.B.
Thanx, Leo. You're a great sport. By the way, partially because of the application of xlq in my screen, I have passed 30% up in the market this year!!!!
- B.H.
This is a wonderful product -- simple to use and just plain useful!
- C.B.
I want to say you have created THE ULTIMATE data interface software for traders like me who prefer to use Excel for everything. Thanks a bunch.
- M.Y.
I just wanted to say, that I very much like your xlq package. I have tried many similar products and this is by far the best I have come across. Simple, fuss-free setup, integrates well with Excel, and has its own stand alone interface to track your portfolio throughout the day. Since I am from Europe, and trade US, European and Japanese securities, the ability to use a variety of feeds simultaneously and transparently is particularly valuable to me.
- H.S.
I really appreciate your quick responses. And your program is terrific. The Plus version adds a lot with it‘s AAII interface. I’ll definitely register it since in the last week it has become an indispensable part of my stock analysis.
- R.S.
I found XLQ yesterday afternoon – and I am blown away by how useful it is. You really need to market this thing because it is AWESOME!!!
- D.B.
Your explanation was very good. I understand now and find it very useful. If you always reply so quickly to questions, I will have to believe that you supply the best and fastest support of any software company.
- D.H.
I have “dabbled” for several years creating many of the things you present in this great program. I first began using the “*.iqy” external query (update times horrendous), then Excel VBA and lately attempting to learn “C” or “C++” in order to have smoother, faster updates as well as a great appearing “front end”. Your program certainly is, by far, the leader and has the greater edge over any I have seen, or tried to accomplish. Thank you for such a great program.
- R.H.
You are a very special person to reply so quickly and I want to thank you again. I enjoy your program. It gives me everything I need, and I know there is so much more functionality that I'm not even exploiting.
- F.D.
I love your program. XLQ combined with the power of Excel brings limitless possibilities to manipulate data for better trading. I recommend it to everyone I know interested in trading.
- P.S.
Thanks for such a great program. I have no programming experience and was trying to find a way to do just what you have done. Only you did much more. It’s fantastic and reasonably priced too!
- D.T.
Thank you so much for your help and your phenomenal programming. XLQ is awesome.
- T.K.
I use your XLQ product all the time. Some of the best money I've ever spent on software.
- L.S.
First, a thank you for the excellent and useful adjunct to EXCEL. I seem to discover a new use every day – and I’m sure I haven’t even scratched the surface to utilize XLQ’s full potential. The new version is really great.
- W.H.
First let me say that I feel XLQ is terrific. I really appreciate the versatility you have made possible with this package. I have set up a few worksheets and find it easy to learn and use with the aid of the included demo sheets. This application has the potential in my opinion to be unmatched in power, efficiency and productivity.
- C.A.
Your software is on its way to becoming the only window that I need to the market’s numbers. With the ability to arrange thing EXACTLY the way I want them, and the use of conditional formatting to trigger alarms and display changes to suit my needs, I am gradually replacing all of the other market tools I’ve been using. I can’t be a more enthusiastic supporter of what you are doing. Thanks.
- W.G.
I'm wowed by your software!! I used to enter data in my spreadsheet for two hours for each update, and therefore only did it once or twice a week. Now I do it with the close each day - in about 30 seconds!!! And I've added some data points to help with my analysis that I just could not manage to maintain before. Thanks again for a great program, a great deal, and great support!!!!!
- R.K.
Your software is great. I'm hooked on the info I can generate for stock purchasing and selling using your program. In two weeks I've become an XLQ junkie.
- V.D.
Please let me tell you how much I have come to depend on XLQ in a short period. This is a great product!! You have made my job significantly more streamlined, and my tasks simpler and more elegant. Many, many thanks!
- L.D.
I have been evaluating XLQ for the past few weeks and am thoroughly impressed with the product. It is versatile, easy to use, accurate and very intuitive. It is a real bargain compared to competitive products plus it runs right from within Excel. Based on this I just entered my purchase order.
- M.M.
I ADORE your program. It has really helped me to learn about how the markets work, and building my own system indicator by indicator is the best way to learn.
- B.K.
Leo: count me as a satisfied customer. I gave it a good workout for a month, decided to buy it when it saved me 5 hours of administration the first week, and helped me do some studies I had been postponing for months due to slow data retrieval. Your product is smooth, fast and elegant with a very clean presentation. Well done!
- K.L.
The more I work with XLQ, the more I like it. It is fast! And so rich... I like it so much I have decided to adopt it as my #1 tool for the long term.
- S.C.
Thanks very much for writing XLQ - I like it very much as it gives me the opportunity to manipulate data as I want without a very steep learning curve.
- T.B.
I just downloaded a trial of XLQ and have been "playing" with it for hours. I am so impressed. I wish I would have known about your program years ago.
- D.F.
I just purchased your software and think it is the next best thing since the spreadsheet.
- R.D.
Thanks for the best (and least complicated) investing software out there!!
- F.B.
Your software is simply brilliant, for the last week that I have been trying it, I have been impressed no end.
- G.R.
Thanks, Xlq is a great piece of software, its actually saving me a heap of time and time is the precious commodity in these hectic days.
- J.P.
The XLQ interface with Excel is excellent. I have been waiting for this capability for years.
- H.A.
Please accept my thanks for your wonderful product - it is a pleasure to use.
- D.L.
Your software is just what I have needed. It provides me with the capability to customize data and construct charts which give me the views I like - not just what someone thinks I would like.
- D.E.
Firstly, let me say that the philosophy and idea behind XLQ is exactly what I am looking for.
- S.P.
The more I use XLQ the more I appreciate what can be done with it.
- S.M.
Just like to say, excellent work. A potentially good bit of software for me.
- M.C.
I love your product so far. ... Thank you for making such product available.
- A.T.
Thanks for the Tip. You know, your program is really super.
- P.B.
Great software! Simple, elegant, well-thought-out and fast.
- R.M.
I am always finding new ways to use your program in my investment / speculative Market endeavors.
- S.S
Thanks for such a wonderful product. It certainly does handle my most precious need which is to monitor the market realtime..
- W.B
It is a pleasure doing business with such a responsive person who obviously understands the value of good customer service. I have just registered and intend to make good use of this program.
- E.D.
Your fast and thorough answer is more than what I expected. Your service is awesome and your product is very stable. Keep up with your good work. Sincerely appreciated :)
- V.P.
Just a note to let you know that I really like you software. It's a wonderful interface that has been of great utility to me.
- J.B.
Join the XLQ Users Group
Books
xlq has been recommended in the following:
Van Tharp